SAT Math: Probability and Statistics
Updated with new Question Bank questions released 7/31/26
This post covers three of the seven skill types within “Problem-Solving and Data Analysis” on the SAT Math: “Probability and Conditional Probability,” “Inference from Sample Statistics and Margin of Error,” and “Evaluating Statistical Claims: Observational Studies and Experiments.” These three skills are not the most commonly tested: they combine for less than a third of questions in the Problem-Solving and Data Analysis category, which is in total about 15% of SAT Math. That means you can expect either 1 or sometimes 2 of these questions across the 44 questions in the 2 Math modules.
These are concept-heavy questions: some of the Statistics questions would look right at home alongside some of the Information and Ideas questions on the Reading/Writing section (though, as we’ll see below, the rules for solving these are fundamentally different from similar-looking Reading questions), and even on the questions that do involve computation there’s not too much you can do with advanced features of DESMOS to speed yourself up (though you will certainly need the basic calculator functions).
Contact me if you see something on here you’d like elaborated on.
All answers to included SAT Question Bank questions can be found most easily here, using the number at the top. All questions and answers originally come from the official SAT Question Bank, although I’ve added my own numbering for ease of communication. If you want to do the questions and check your answers as you read, I’d recommend clicking the bold link now so you have it ready.
What are Probability and Statistics?
The Basics of Probability and How to Represent It as a Number
• We don’t use a deep (conceptually or mathematically) understanding of probability for the SAT, so I’ll be quick here
• Probability is the chance of something happening, between 0 (certainly won’t happen) and 1 (certainly will happen)
• We often represent probability as either a fraction or a decimal or a percent
For a decimal, as mentioned, it just needs to be at least 0 and no more than 1
So for a fraction, a probability has to be a proper fraction, with a denominator larger than the numerator
When the answer is a fraction, the question may ask for “the fraction of” the group that meets a condition, rather than explicitly asking for a probability
For a percent, it will be at least 0% and at most 100%
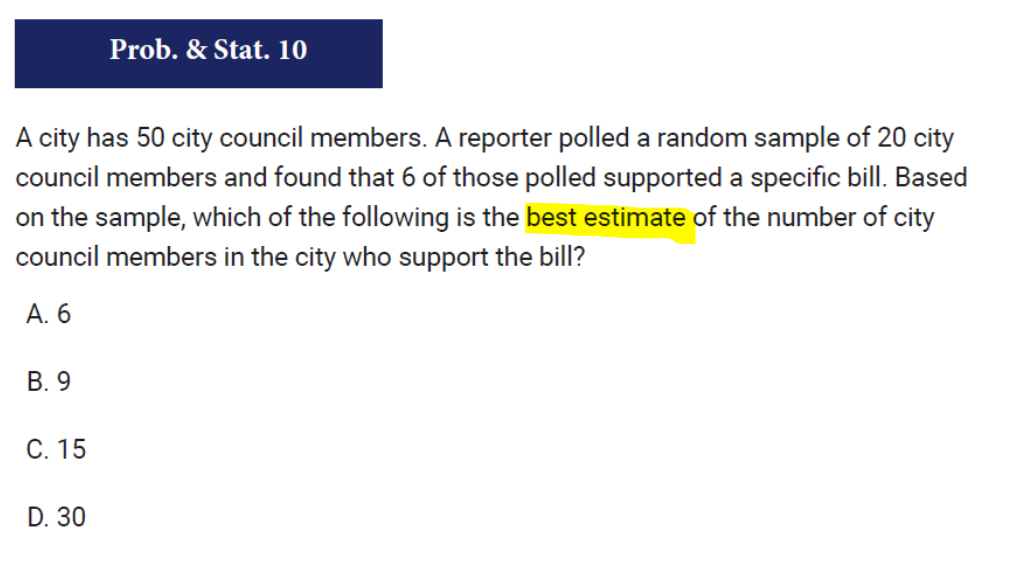
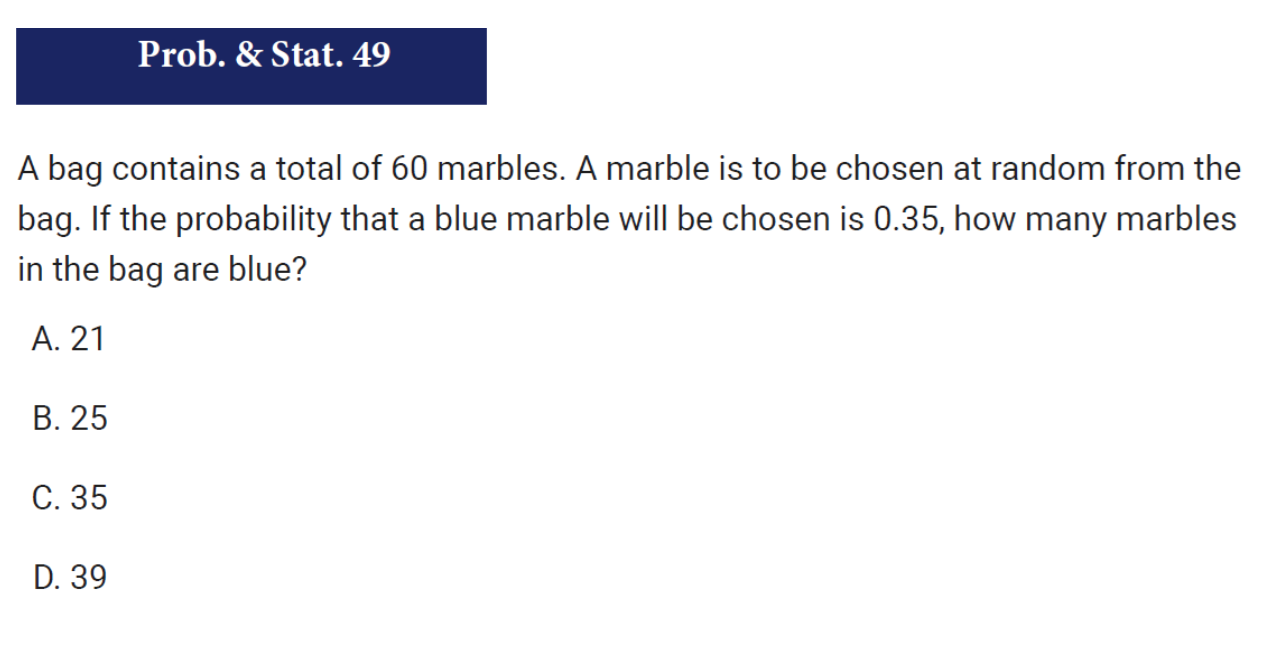
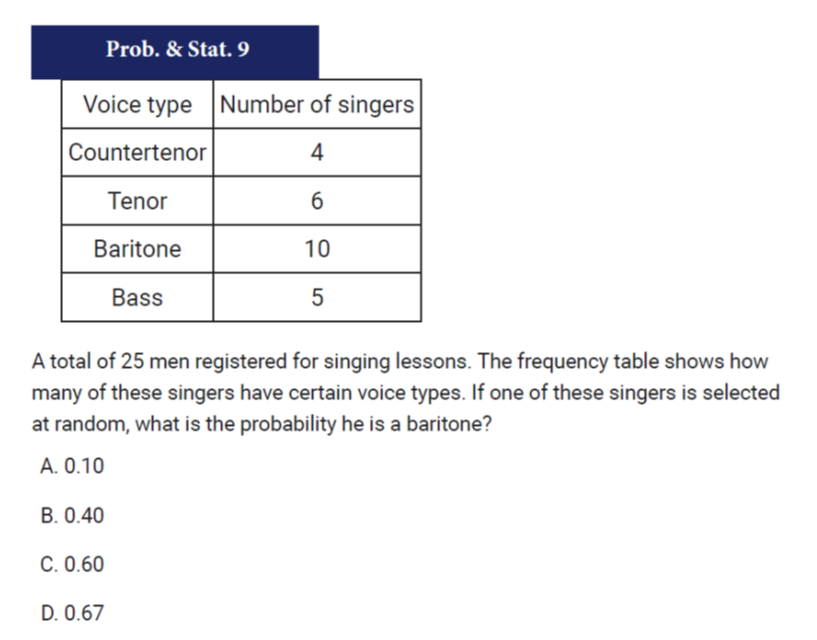
• Also, some questions of this type ask for a probability as the answer (see question 9 below, the third question down), while others give probabilities or other percentages in the question and will ask for a whole number as the answer (see questions 10 and 49 below, the first two questions).
For a quick example, if we’re looking at a group of violinists and the languages they know, the first type of question would tell you how many violinists there are, how many know Spanish, and then ask for the probability that a given randomly selected violinist knows Spanish
Whereas the second would give you the total number of violinists and the probability that a randomly selected one knows Spanish, and ask you how many of them know Spanish
• When the given answer is a probability, the SAT usually wants it to be represented either as a fraction or a decimal
On a multiple-choice question you know what form they want by what form the answer choices are in
On a Student-Produced Response question (not multiple-choice) that asks for a fraction or decimal, they will mark an answer given as a percent wrong. See for example question 22 below—on this question, writing the answer as a percent would give a value 100 times as large as the correct answer.
However, on some occasions they do specifically want a percent, and will say so clearly (see for example question 30 below). Here they will mark the decimal answer incorrect—it will be 100 times too small
Probability vs Statistics
• There are two types of problems that involve probabilities:
Those where we treat the probability as known or precisely discoverable (marbles from a bag, or if you have data about an entire population)
These we can think of as probability in the proper sense
Those where we treat it as an unknown we want to estimate as closely as possible (survey of part of a large population). These are often about acknowledging or measuring uncertainty just as much as they are about calculation
These are statistics problems. We can think of statistics as a well-developed set of rules for deciding how much we can reliably infer about a population from having access to a smaller sample of that population that we test (observe, survey) directly. To put it another way, statistics is a methodical way of managing uncertainty.
In statistics, population doesn’t have to mean a group of organisms like in biology. We mean more generally the larger group we want to learn about but which we can’t fully access (because of time, costs, etc). It could be people, animals, or plants, certainly, but it could also be products in a factory.
Types of Probability and Statistics Problems
Here I’m departing a bit from the way the College Board organizes the separate skills, by putting the most similar question from each into the first category
There is a certain class of problem that feels relatively similar regardless of whether it’s strictly a probability problem or a statistics problem. In these the uncertainty that’s characteristic of statistics problems is mentioned but isn’t directly asked about. I call these General Probability/Statistics Questions below.
2. They can get more complex by asking what can be inferred from a study on a particular sample.
These are the true “statistics” questions, and they are complicated because they require reasoning about data collection. We’ll look at 3 types
Qualitative (descriptive) understanding of uncertainty
Quantitative (numerical) measurement of uncertainty: Margin of error
Identifying random vs biased sampling of a population, and identifying which population has been randomly sampled
All these in a way look similar to some Information and Ideas questions on the reading side, but they are more technical and so can be approached more formulaically
3. They can also get more complex by asking a “conditional probability” question about the fraction of a subgroup belonging to another subgroup.
These are the true “probability” questions, and these may be more mathematically complicated. At least, we can say that they involve sifting through more numbers (although we will see at the end a few questions with tables that aren’t conditional probability questions)
General Probability/Statistics Questions
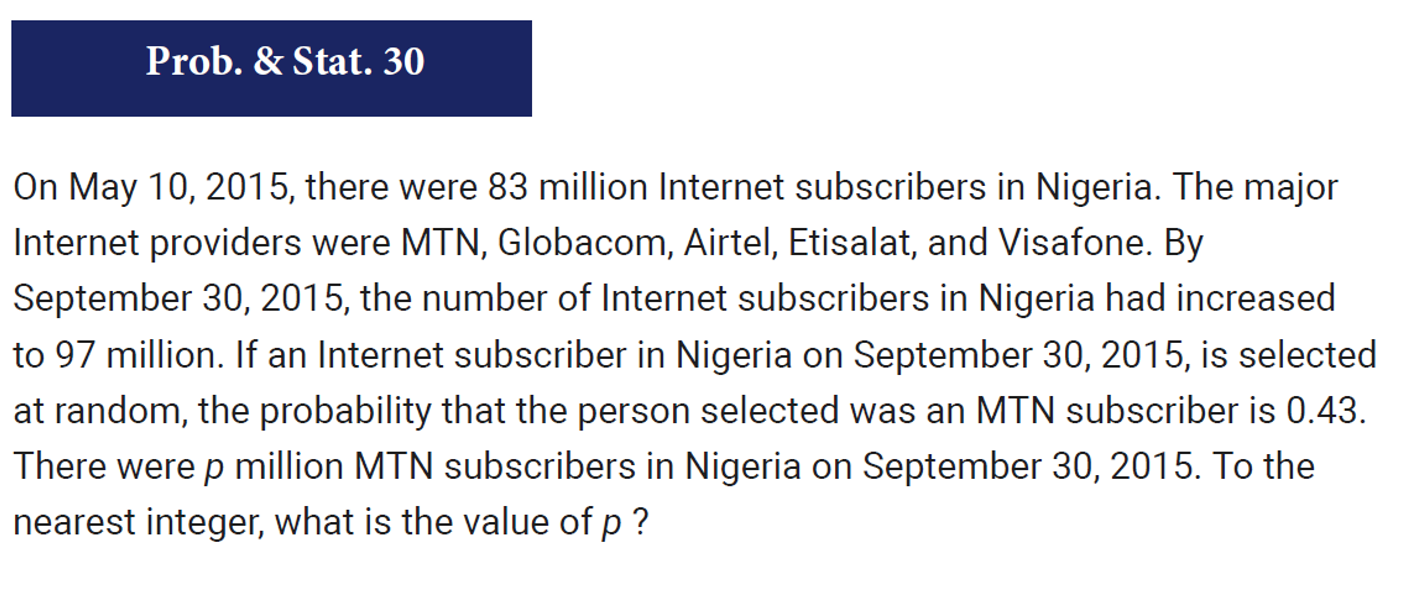
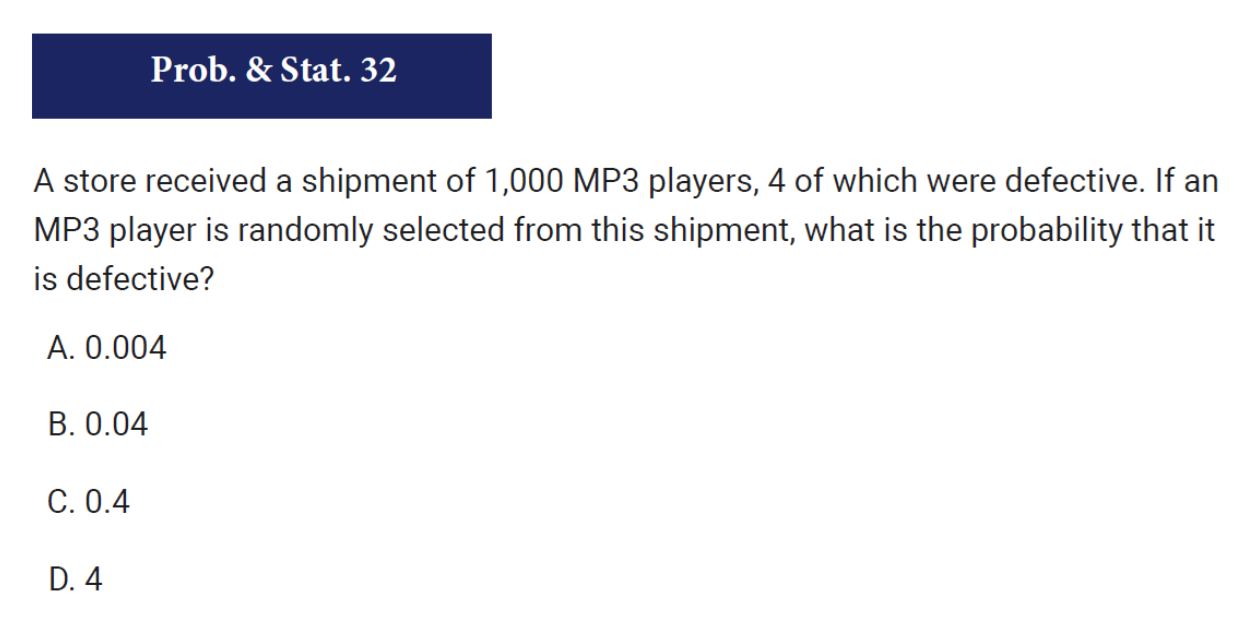
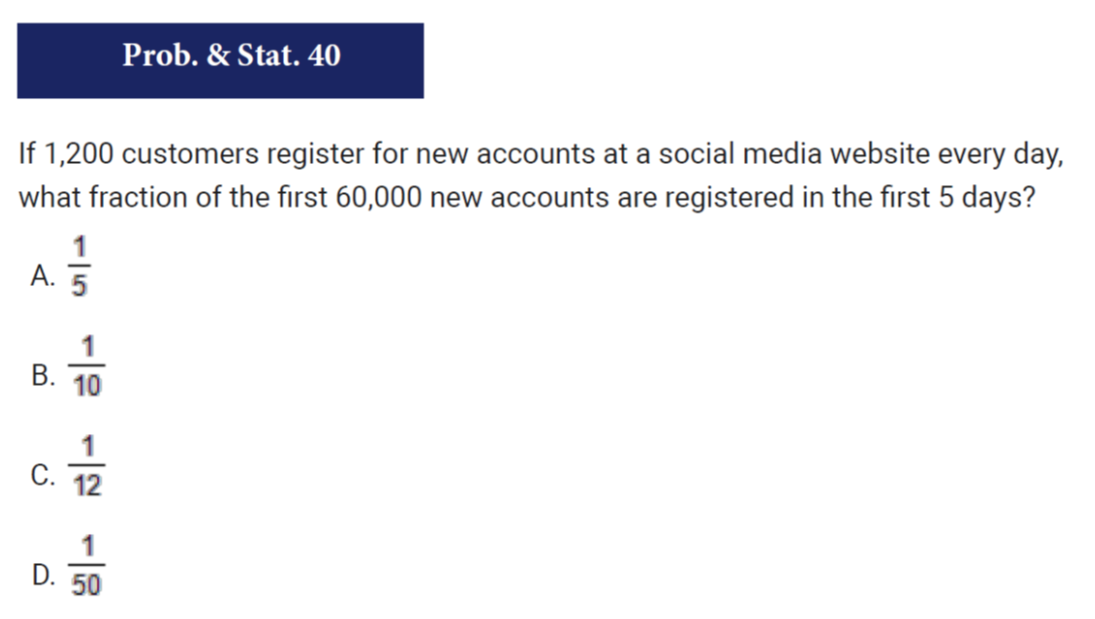
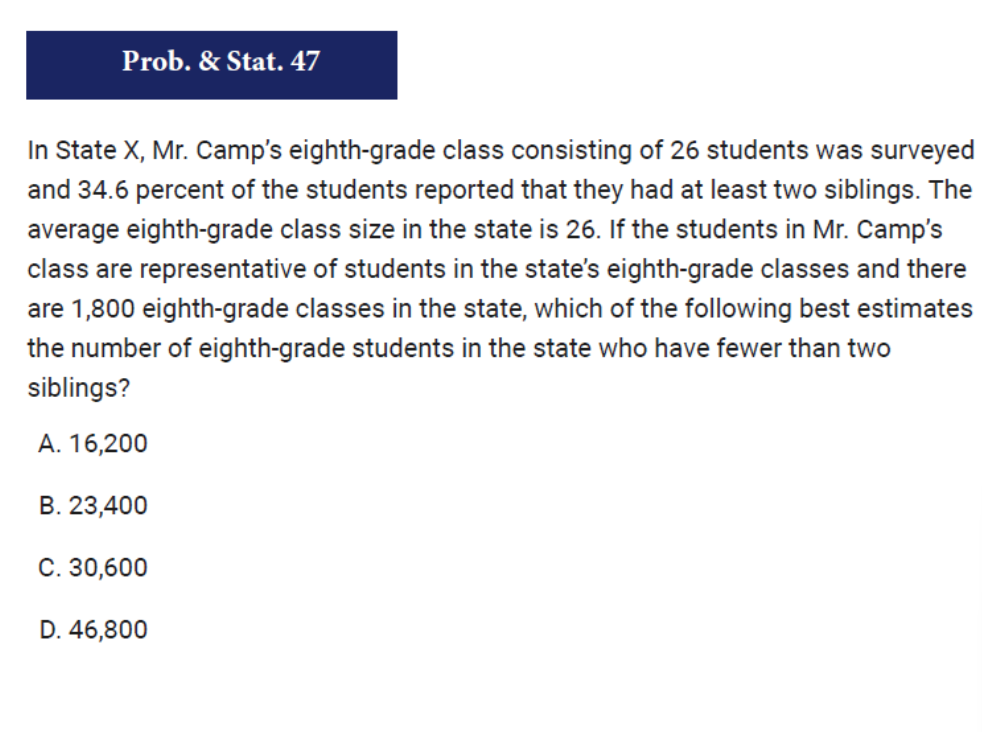
As alluded to above, here the questions are relatively similar to solve, regardless of whether they are statistics questions about a population of which you have partial knowledge, or probability questions about a situation where the probabilities are precisely knowable. Some probability questions will ask you for a probability as a fraction, decimal, or sometimes percent (as mentioned above, if they want a percent, they will say so clearly). Other probability questions will give you a probability and ask for a whole number. The statistics questions will be similar to this second type. The clearest difference will be, if it’s a statistics question, it will ask for the “best estimate,” whereas in a probability question it will just say “how many,” but this difference won’t affect calculation. These problems, whether in probability or statistics, are often one step to calculate, but can have multiple steps.

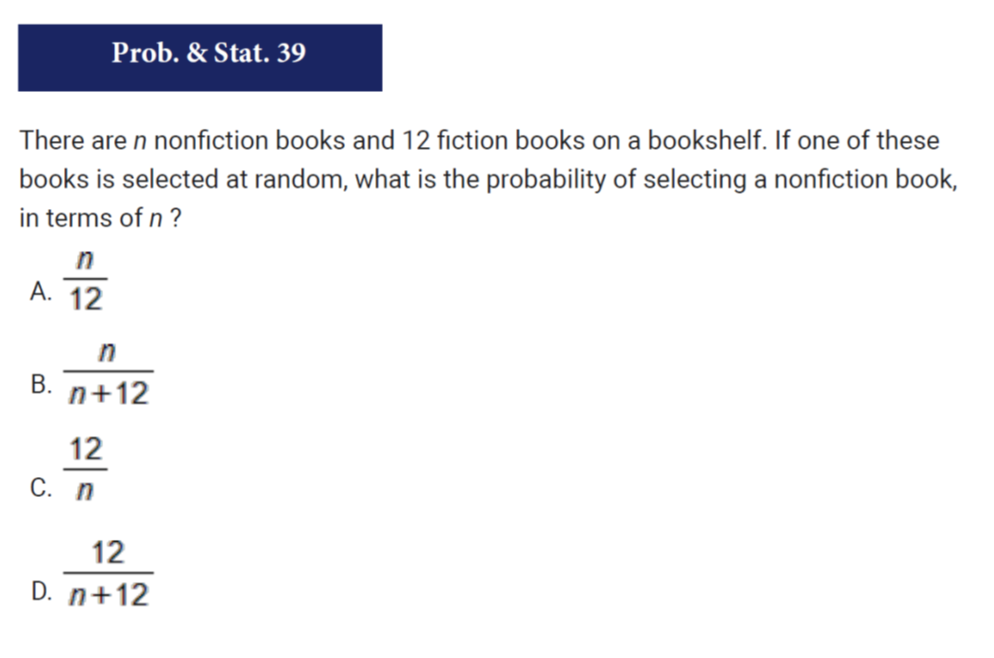
You should always be ready for the SAT to turn a problem of a given type into an algebra word problem (that is, they may introduce variables. I’m not referring specifically to the Algebra section of the test).
Distinctively “Statistics” Questions: Drawing Conclusions from a Study
The next group of questions are those that specifically ask you to reason about how much can be learned about a population from a study which engages with a sample (a limited group) from that population.
You can think of it this way. Already in the earlier questions from the statistics side, there’s a reasonable caution implied in the phrase “best estimate.” When you use a sample of less than the full population to try to learn something about the full population, you know “error” in the measurement is possible and in fact highly likely. In these questions, we focus more directly on that caution and how to understand it, rather than on the calculation of a best estimate which you were doing before.
There are three parts to this, corresponding to three types of questions
• Can you express the appropriate caution about what the study tells you
• Can you apply the concept of margin of error, which quantifies this uncertainty
• Can you determine what population the study’s results apply to
Let’s look at the first one of these, which is probably the easiest to manage with prior knowledge, but still has some technical precision to it.
Qualitative Caution
There aren’t too many of these that don’t bring in either of the elements below at all. Nevertheless, they’re worth understanding separately. The essential point in these questions is just that the results of a survey of some sample of a population give you some information about the rest of the population, but do not give you precise results for either the population as a whole or for another group you might sample within the population.
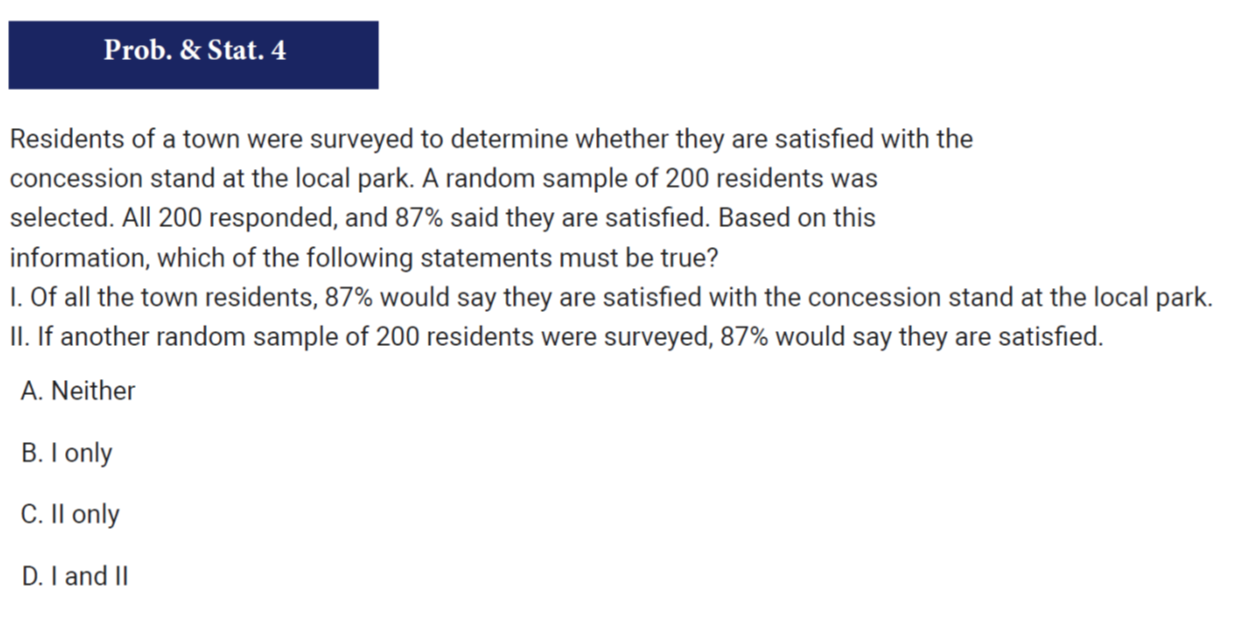
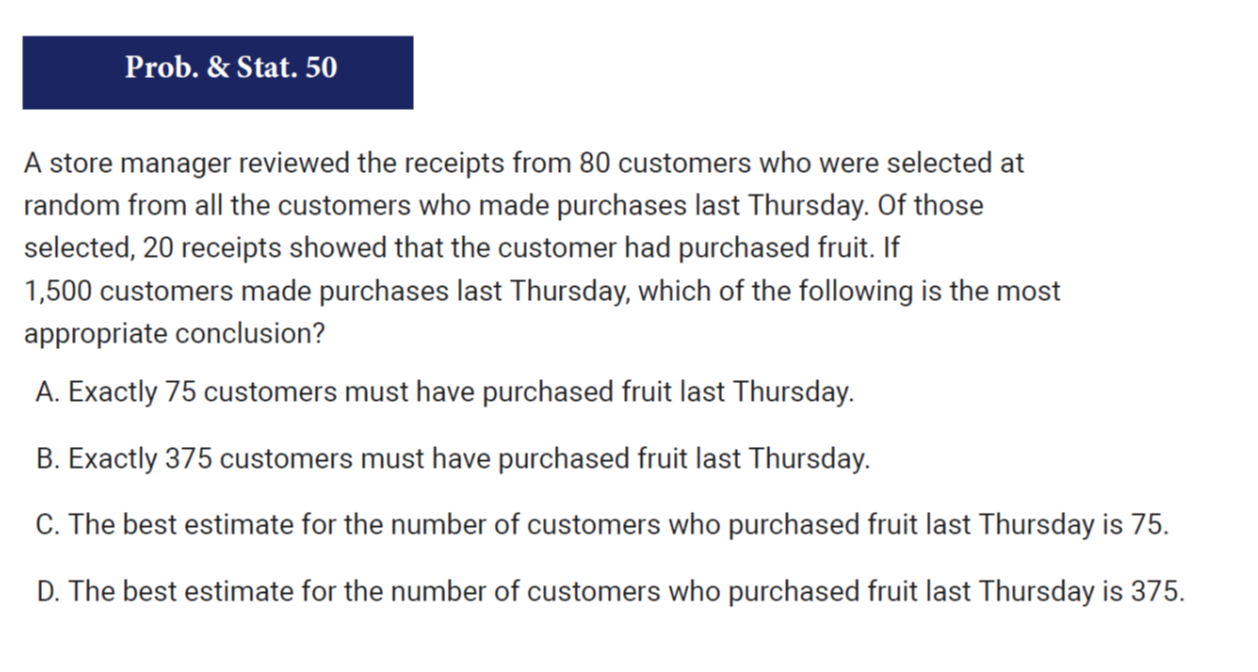
This question has a computation element in addition to testing you on appropriate caution about results of a study.
Quantitative Caution: Margin of Error
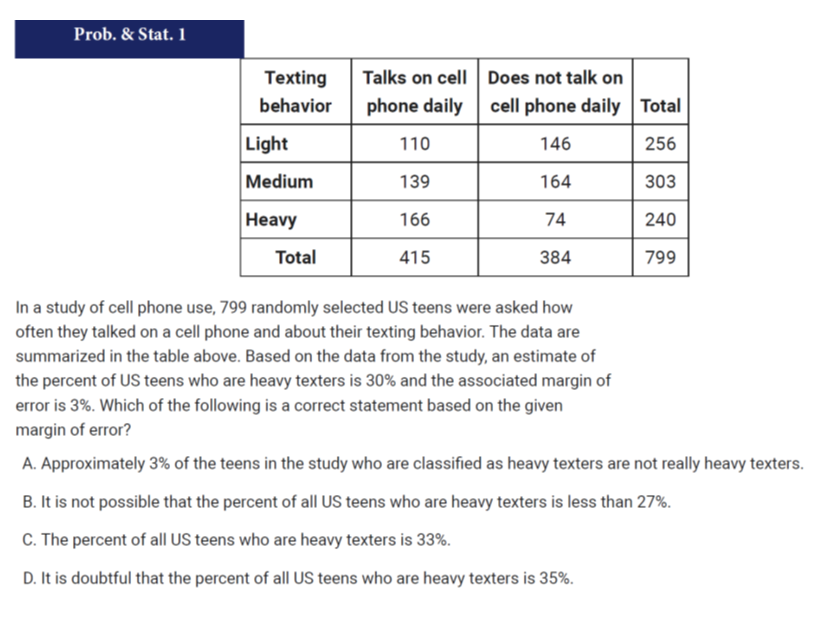
• The margin of error is a way of quantifying (making into a precise number) the uncertainty inherent in sampling less than the full population
• So while the questions before just ask you to acknowledge that there is some uncertainty in making claims about the whole population, these questions ask you to use a reasonable range within which the population might lie based on where the sampled population is
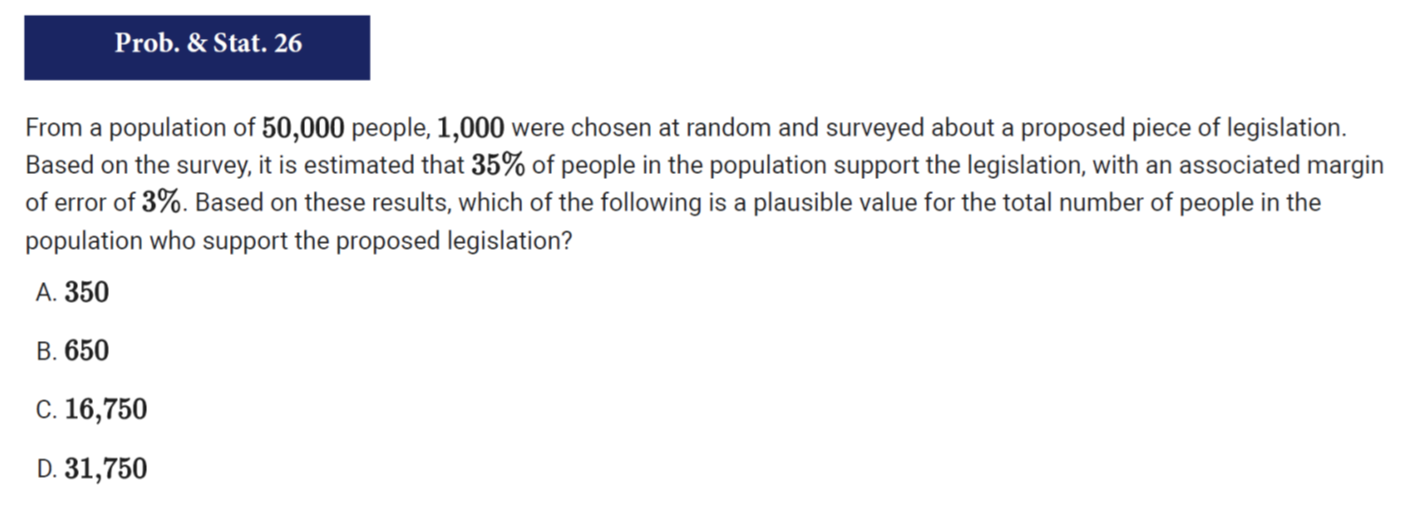
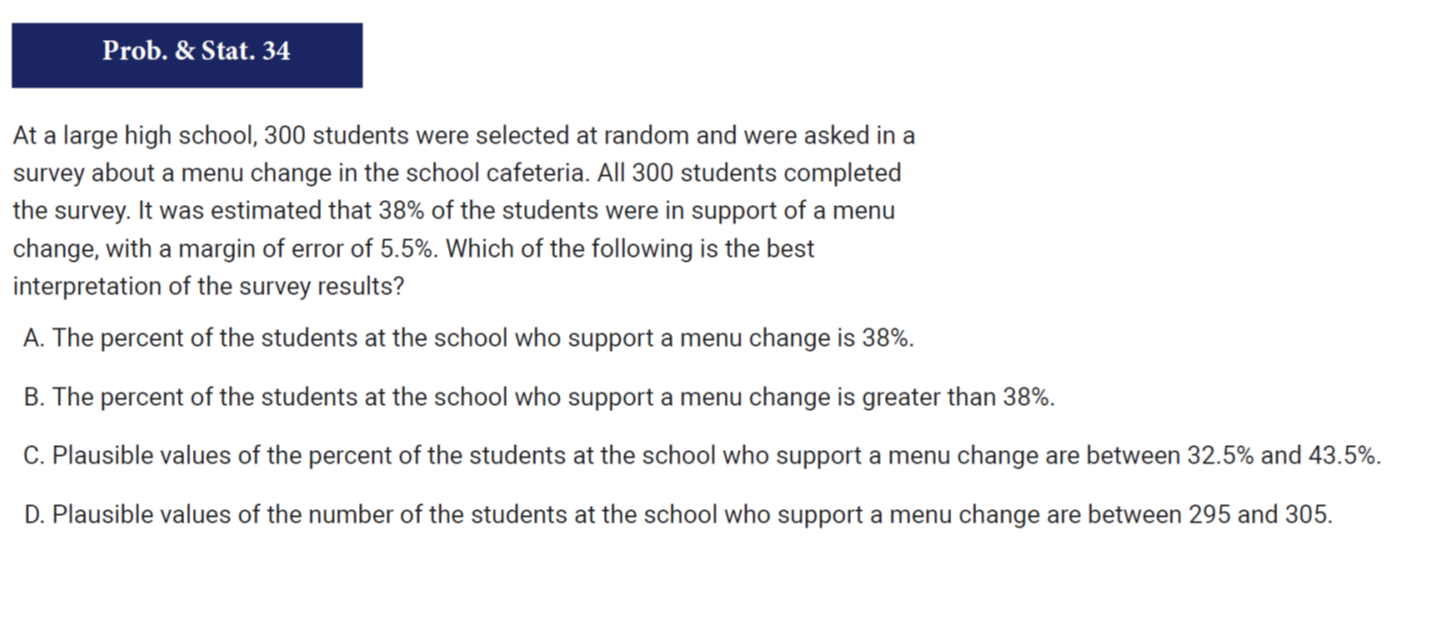
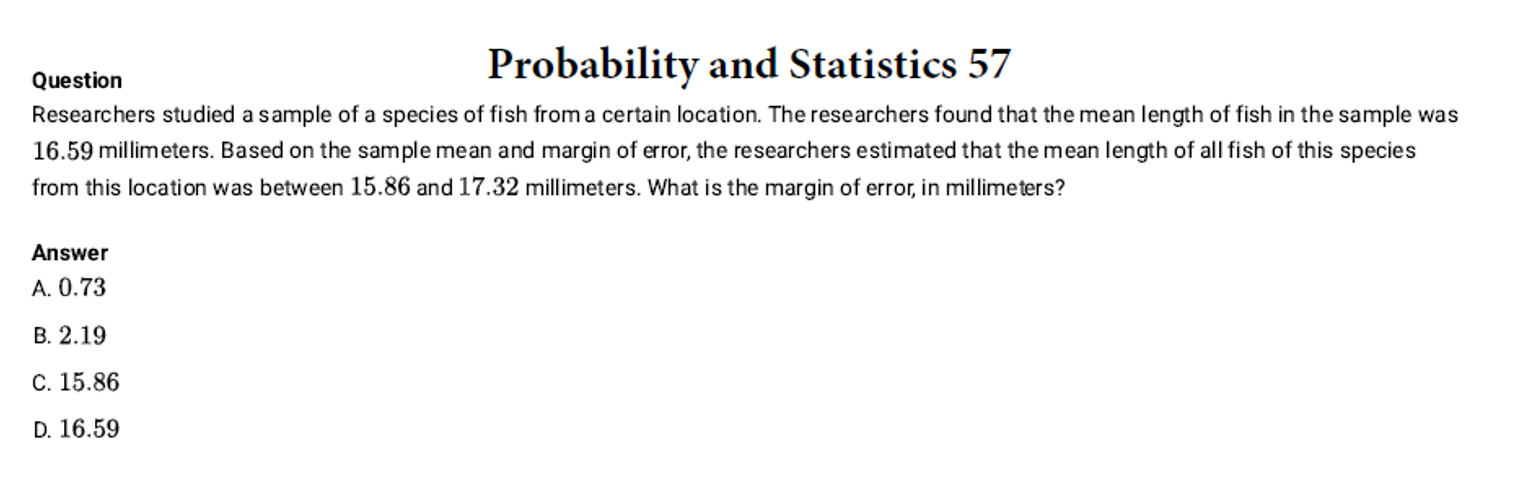
The reasonable or plausible range within which the population could lie is from the sample result minus the margin of error up to the sample result plus the margin of error.
It is unlikely that the true value for the population will lie outside of that range
You may get a problem which asks you to find the margin of error from the sample mean and the plausible range for the population, like number 57 below. In that case, the margin of error is just the distance from the edge of the plausible range to the sample mean (it should be the same regardless of which side of the plausible range you use).
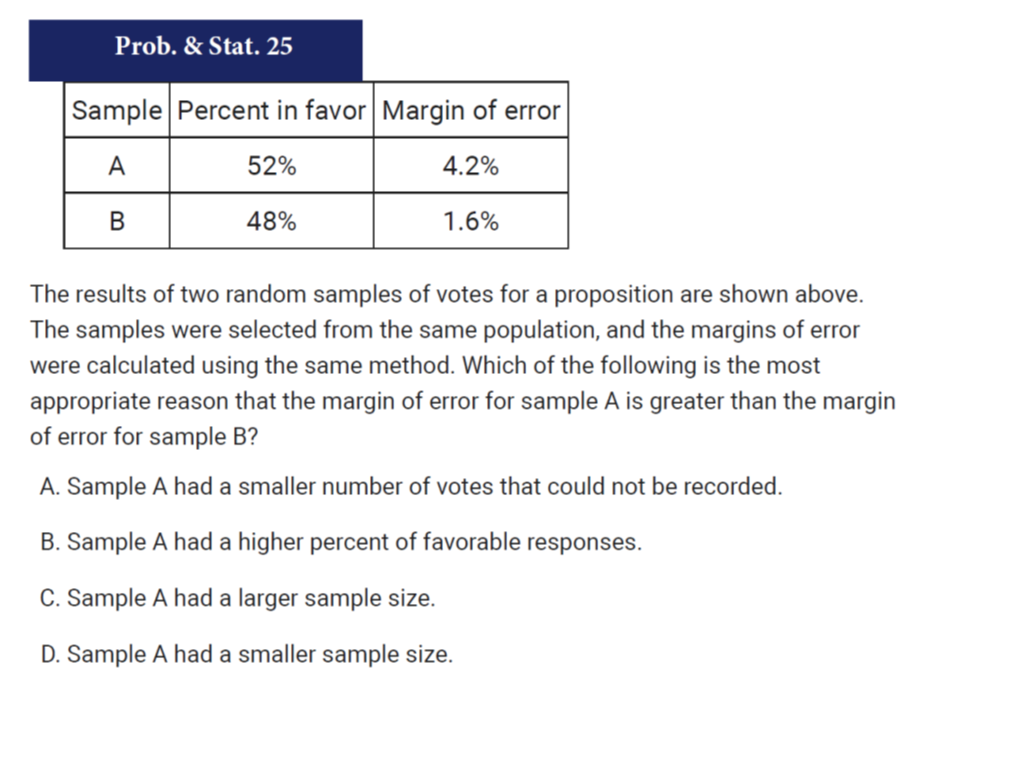
• As you might guess, you have a smaller margin of error if you have a larger sample size. Similarly if you have a smaller sample size, you’ll have a larger margin of error.
This is essentially because, the larger your sample is, the less likely you are to have “bad luck” in selecting your sample.
It’s similar to the idea that, if you flip a fair coin 10 times, you could very well get only 2 heads, which would mean you got 20% heads, very far from the expected 50%, whereas, if you flip a fair coin 1000 times, it would be incredibly unlikely for you to get only 20% heads.
Random Sampling of Which Population
These questions bring in a factor that’s implicit (implied but not directly mentioned) in the other two. When we randomly sample a population without bias we can learn something, within limits, about that population. But when we don’t randomly sample a population, we can’t claim by statistical methods to have learned anything about that population.
If we have sampled only a subsection of the population, then when it comes to learning about the larger population, our sampled would be potentially biased.
Furthermore, sometimes there is clear reason to think that a certain sample is indeed biased.
Let’s take an example of the second case first, since it’s a bit easier to see. if we want to find out about challenges that make it difficult for students to get to school on time, we definitely can’t survey the first 50 students who make it into the building in the morning, since they will give us a very different picture from, say, the last 50 students who make it into the building in the morning. So our sample wouldn’t be representative of the population we’re interested in, which is to say, it’s biased in a particular direction.
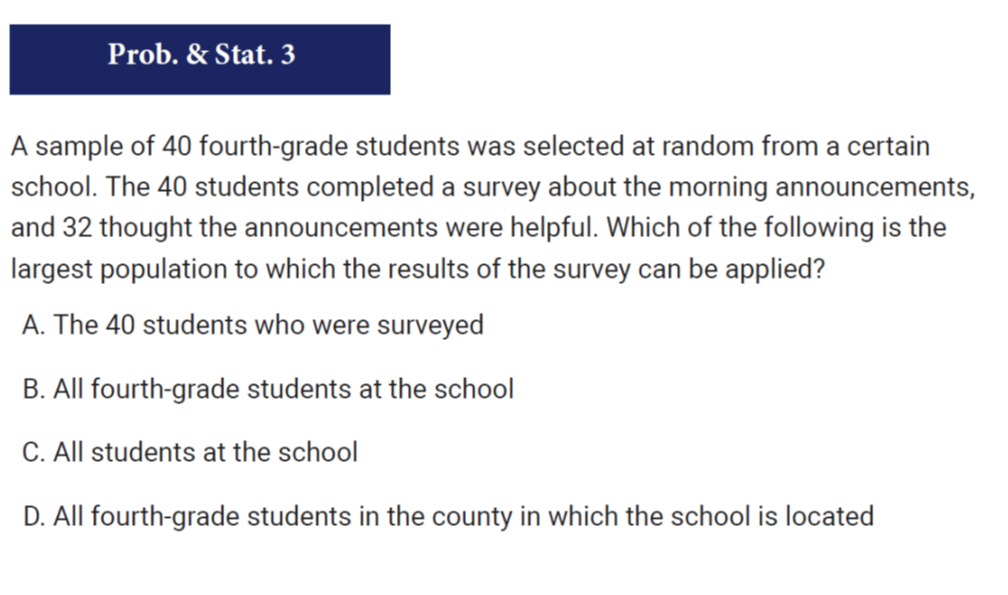
Second, supposing we successfully got a random sample of 50 students from our school on this question. We can still only apply what we learned to the population (this school) that we surveyed. Who knows if another school in the city would be similar? Even if the schools and the populations attending them seem similar, there are too many ways the other school could be different that we might not have thought of. As I mentioned above, statistics is all about managing uncertainty, and the basic rules of the game (at least at the level we encounter on the SAT Math) are, rather than trying to discern whether two populations are similar enough, you just have to randomly sample a population to find out. So unless we randomly selected students out of the population of all students at all schools in the city, we couldn’t apply our results beyond the school or schools that we did randomly sample.
So in order to answer these questions, we need to pay careful attention to which population if any has been randomly sampled. You can usually make some headway by thinking about why, with respect to another population, the sample would be biased or inadequate. But when you can’t, you can still rely on the question: which population is the largest that we can have said to have randomly sampled? (For more concrete tips, see the next paragraph, just before question 3)
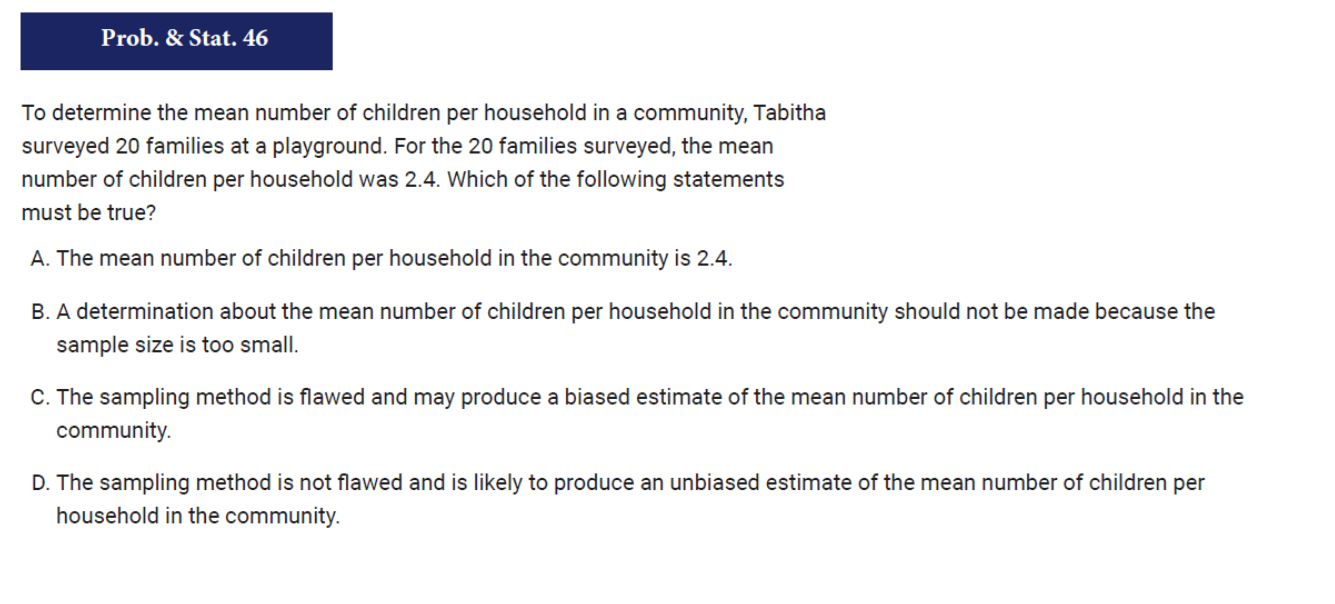
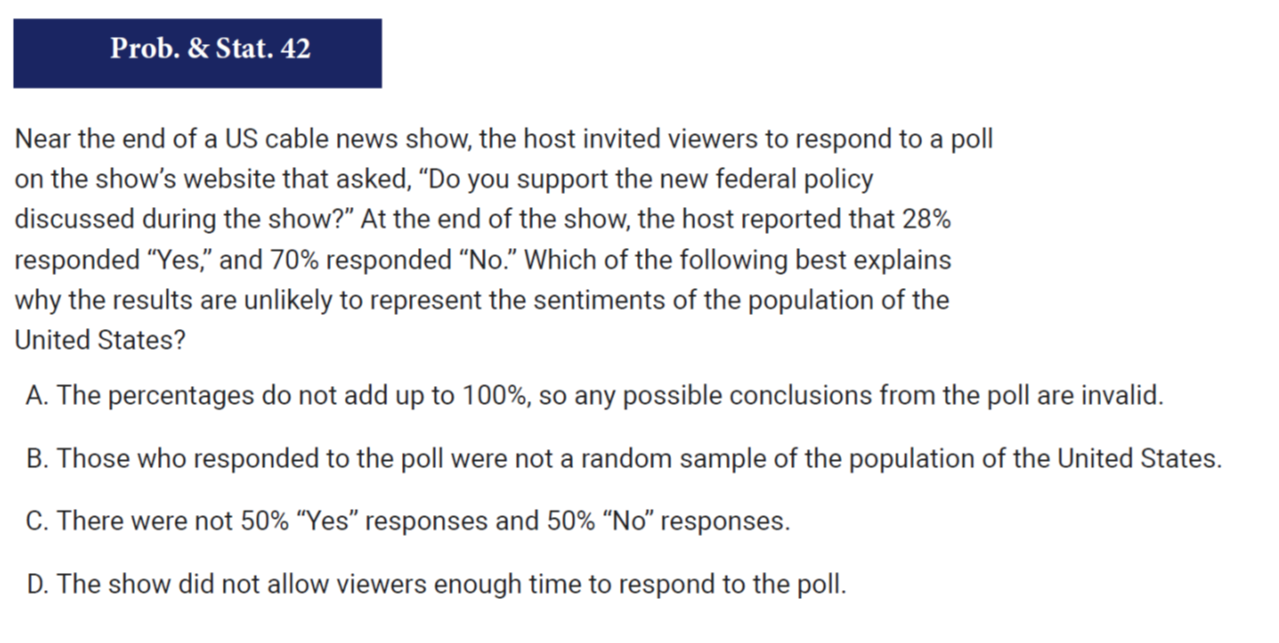
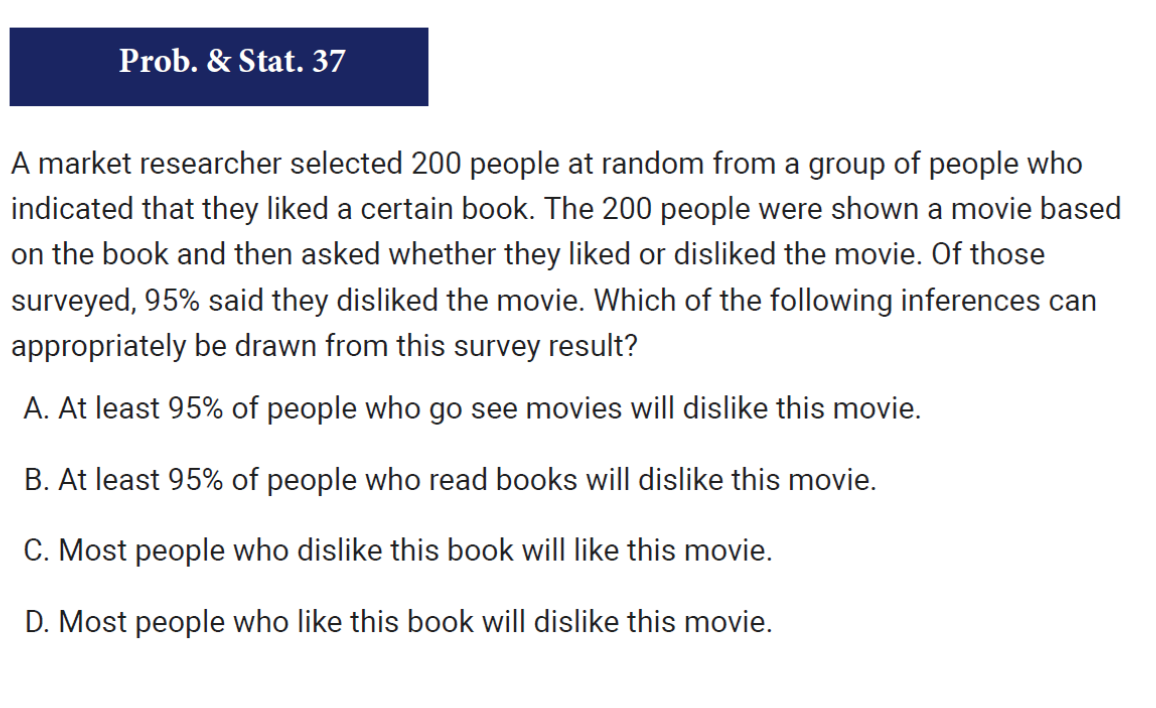
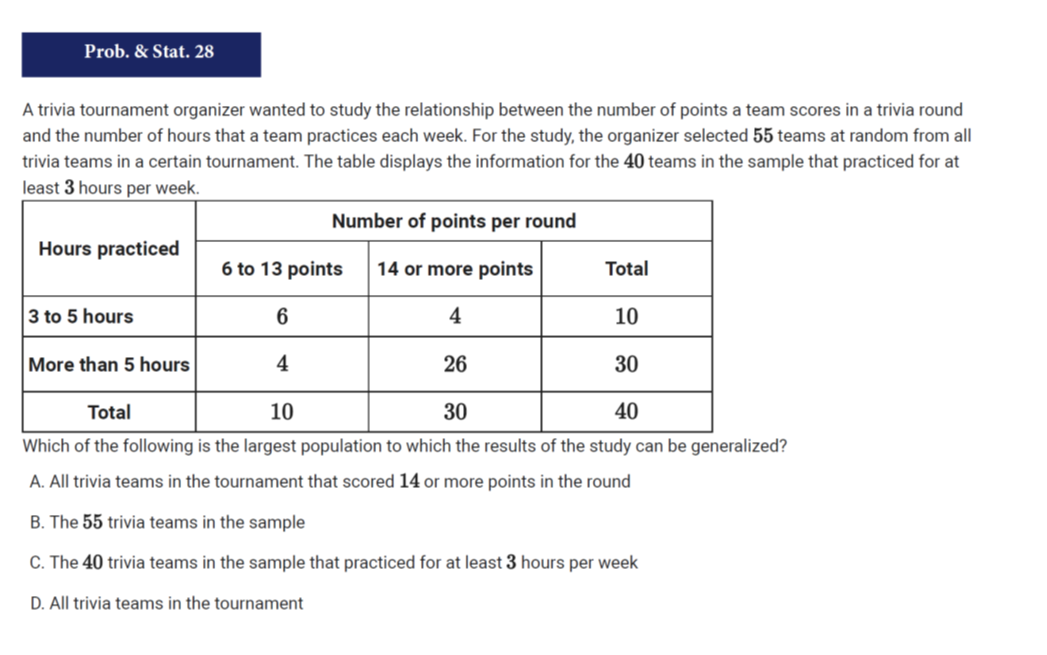
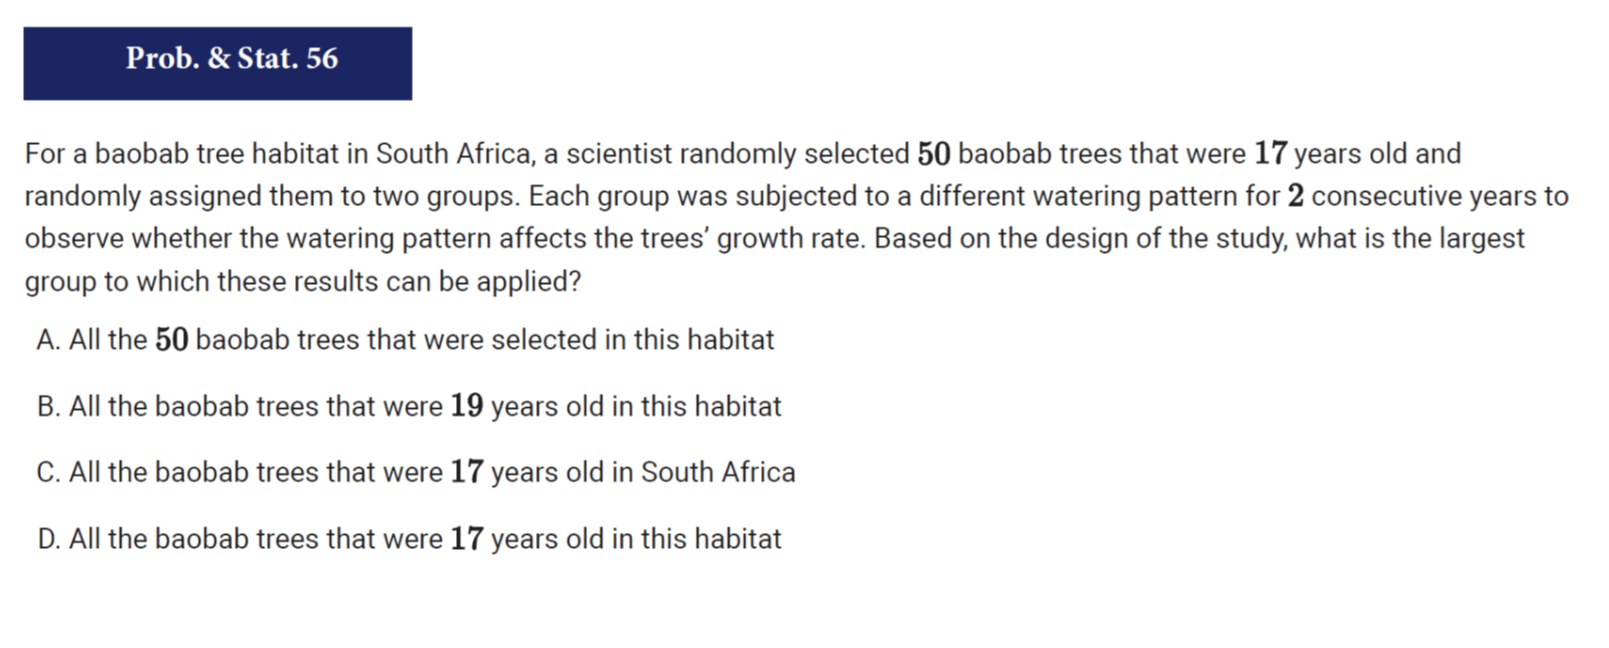
Maybe the most intimidating questions in this category are those that just describe a study and then say “what is the largest group to which these results can be applied?” Based on the fundamentals, they’re similar to the other questions. But whereas on the other questions of this type, it can feel like common sense does most of the work, here you’re given a large enough number of fairly similar options that it can feel hard to be sure. Just remember, the key is to look at where the question describes which population was randomly sampled. Look near the words “selected at random” or “randomly selected,” particularly the words that come right after “from” or “for,” to figure out which population has been randomly sampled.
Distinctively “Probability” Questions: Conditional Probability
These questions can be quick and even maybe fun if you understand the concepts behind them, but if you don’t know the concepts then they will be real head-scratchers.
We’ll look just a little bit at the general idea of conditional probability, and then apply it to the types of questions you could get on the test. If you’re a real nuts-and-bolts person who works best when you just have the methods, you could even skip the explanation.
The Concept of Conditional Probability
Conditional probability in general is based on the fact that although distinct events have absolute probabilities, events are also correlated with one another. Therefore, if we know that some event has happened, then that changes our estimate of the odds of some other event happening.
For example, your chances of winning a raffle may be 1 in 1,000,000. This would be true if you had a ticket with a six-digit number, and there was one ticket for each number from 000,000 to 999,999, and each ticket had been given out to someone. But now suppose that the first five numbers have been called, and all five of them match your ticket? Then we say your odds are 1 in 10!
So before the raffle, we could have said:
Conditional on your first five numbers matching the winning ticket, there is a 1 in 10 chance of you winning the raffle
(or to put it in other terms that you might see on the test)
Given that the first five numbers on your ticket match the winning ticket, there is a 1 in 10 chance of you winning the raffle
And that can still be true while saying that, in absolute terms, your probability of winning is 1 in 1,000,000.
What we’ve done here is create a fraction where the denominator is the number of possible options in the conditional scenario—10—and the numerator is the number of those possibilities that count as “successes”—in this case, you winning!
Conditional Probability Tables
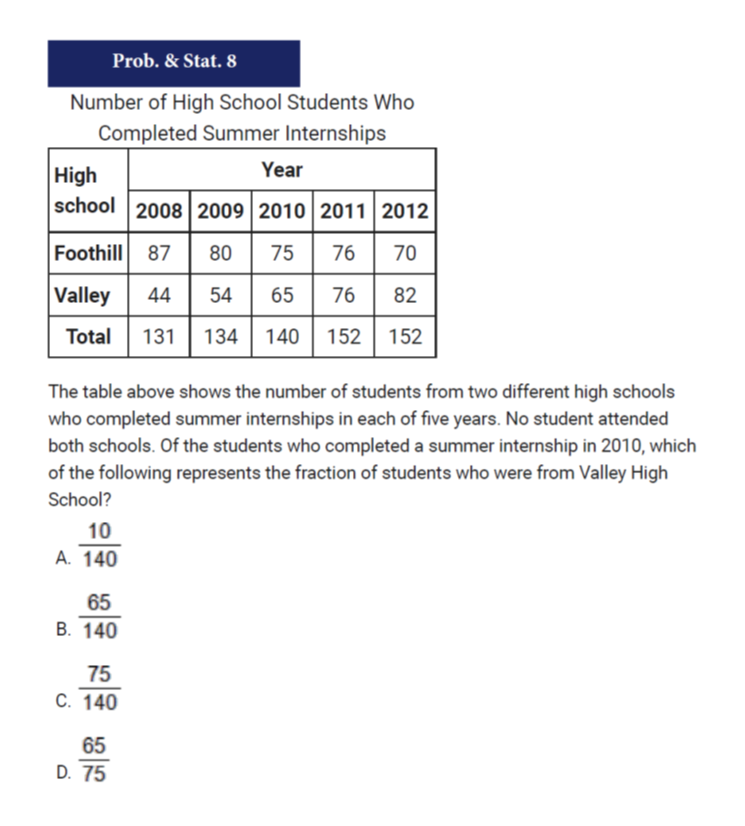
In questions with conditional probability tables, the descriptor after of or given that tells you out of how many people you are selecting, and the other descriptor, often after are or has, tells you how many are “successes.” As a fraction, the descriptor after of or given that tells you the denominator, and the other descriptor, often after are or has, tells you the numerator.
Once you know that, answering these questions correctly comes down to knowing how to read the tables. In the simplest version of this problem, either:
the denominator—the number that meets the “given that” or “of” condition—will be one of the sub-totals along the bottom row or right column of the table, and the numerator will be one of the 4, 6, 8, 9, or 10 inner boxes, the ones that are not subtotals.
or
the denominator will be the “total total” in the bottom-right corner, and the numerator will be one of the subtotals
or
the denominator will be the “total total” in the bottom-right corner, and the numerator will be one of the inner boxes.
The first is the most common, but there are examples of all three in the Question Bank. To figure out which it is, you just have to pay attention to the words in the question picking the numerator and the words picking out the denominator.
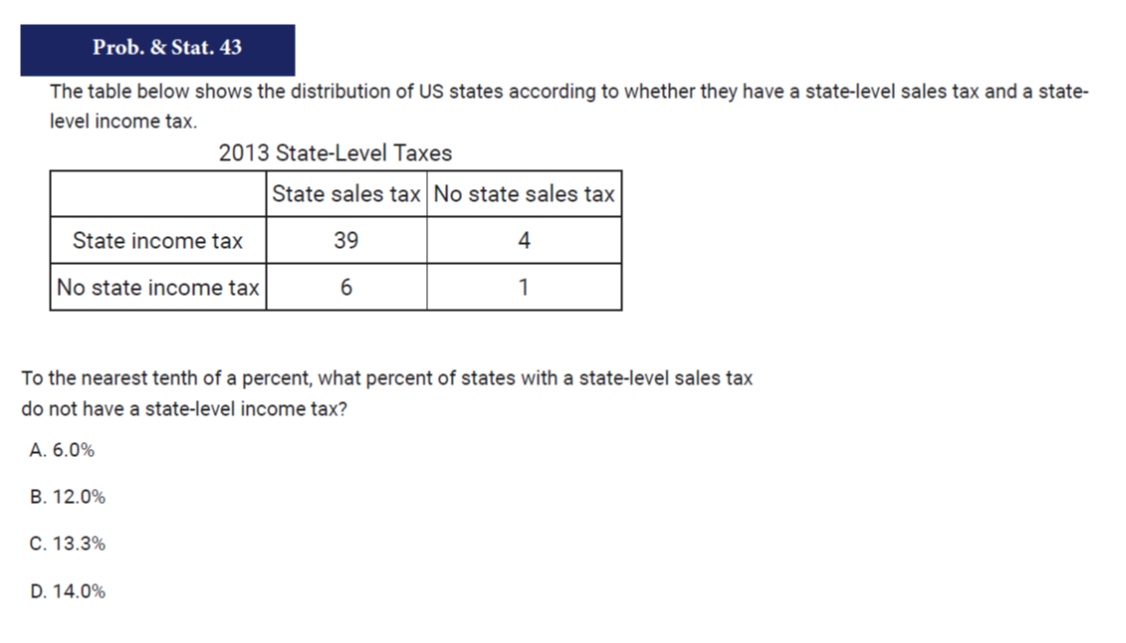
Also note that it’s possible to have a question where you have to find the subtotals yourself, but usually they are given to you (see #43 below).For the first two problems, I include some training wheels in the form of highlighting the denominator and its heading in yellow, and the numerator and its heading in red. The rest of the problems give a pretty good sense of the range of questions of this type. Note also that in one of the problems below, the answer is given as a percent rather than as a fraction.
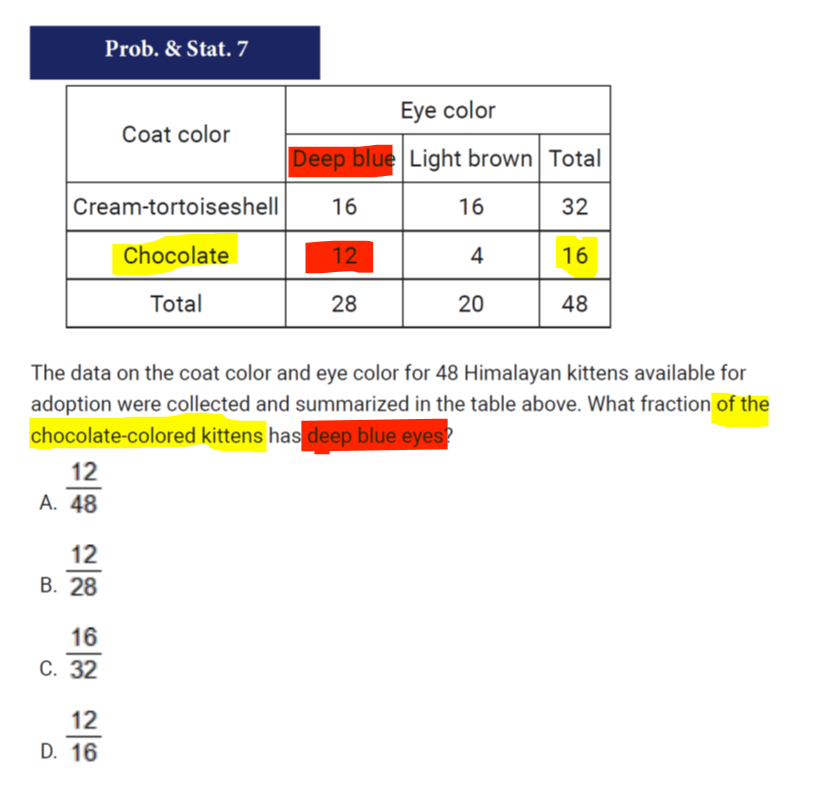
In this problem, because we want a fraction out of the chocolate-colored kittens, we need the total for chocolate to be the denominator, and one of the two eye colors for chocolate-coat cats to be the numerator. As we read on, we see that the numerator is chocolate-coat cats with deep blue eyes.
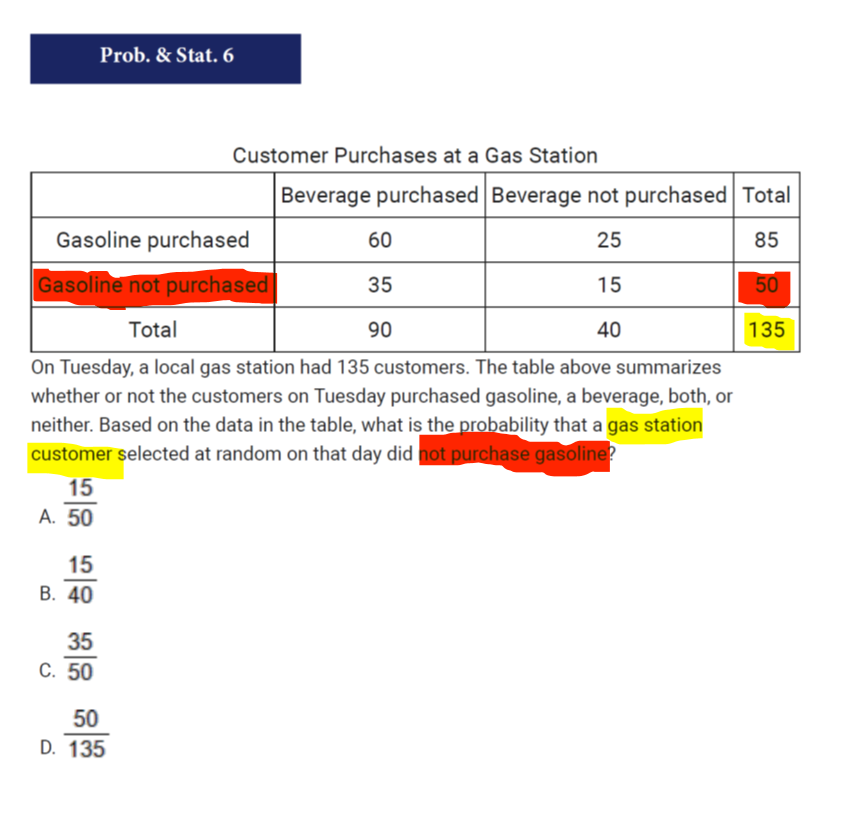
In this problem, because everyone in the table counts as a “gas station customer,” we have to use the “total total” in the bottom right as the denominator. Because the descriptor for the numerator only has to do with purchasing gasoline, we can ignore whether someone purchased a beverage or not, and just use the subtotal on the right for everyone who didn’t purchase gasoline as the numerator.
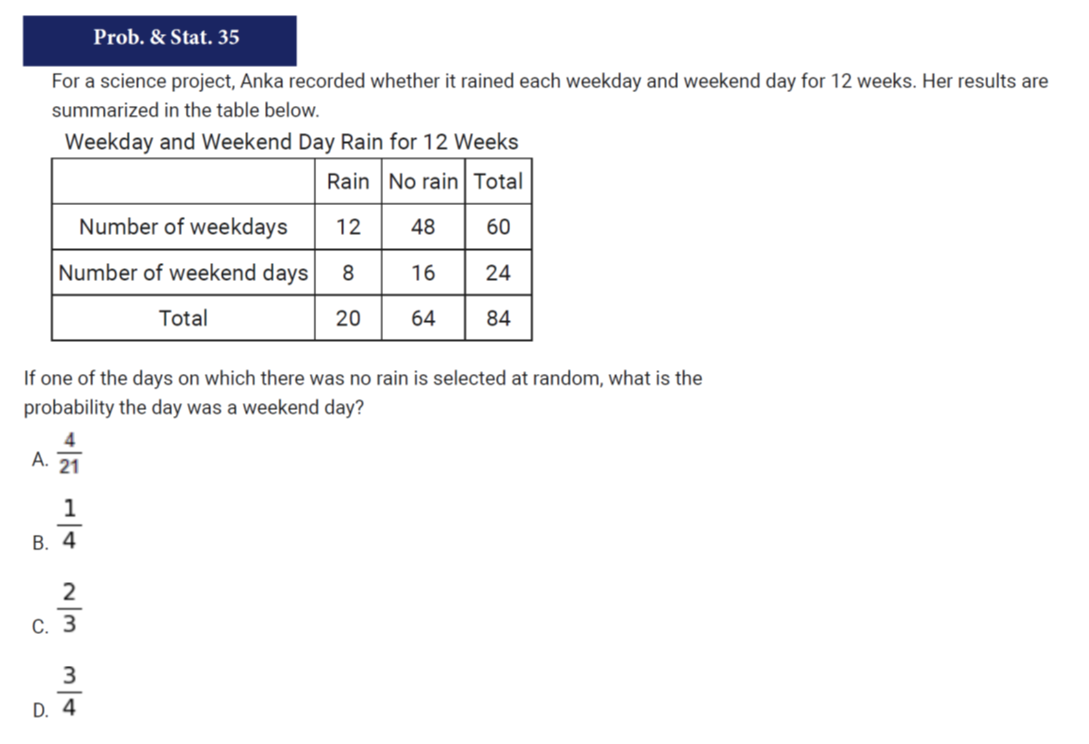
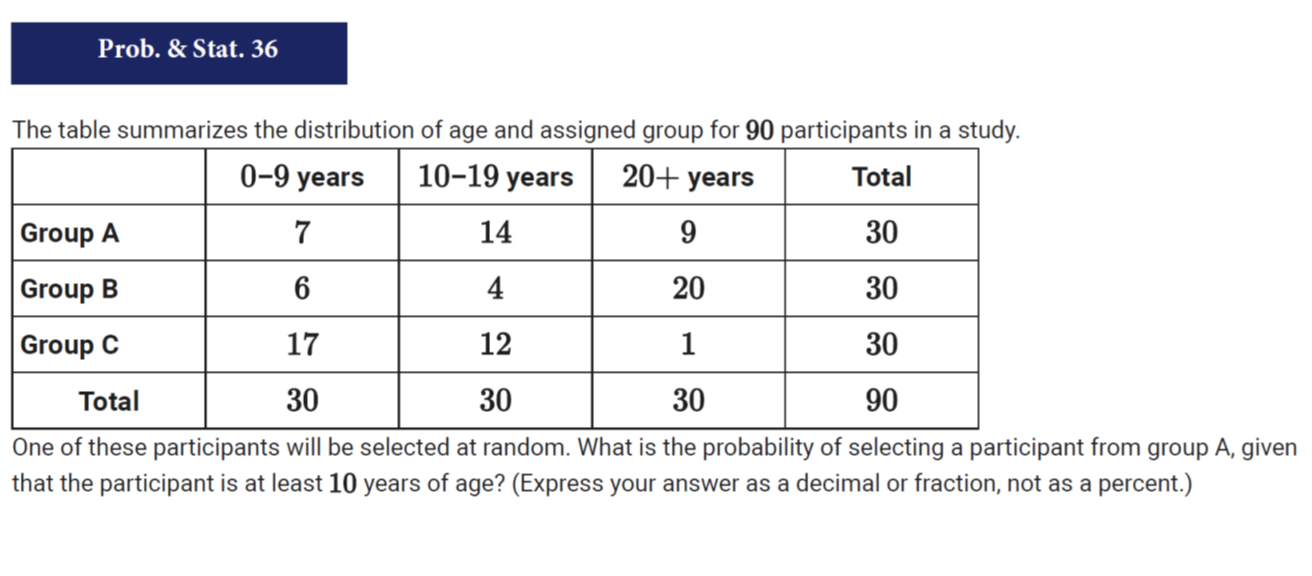
Here we have to add two of the subtotals on the bottom to find our denominator. This kind of question gets even more difficult when it is combined with a table which doesn’t give subtotals. See the first example under “Advanced Problems with Conditional Probability Tables” below
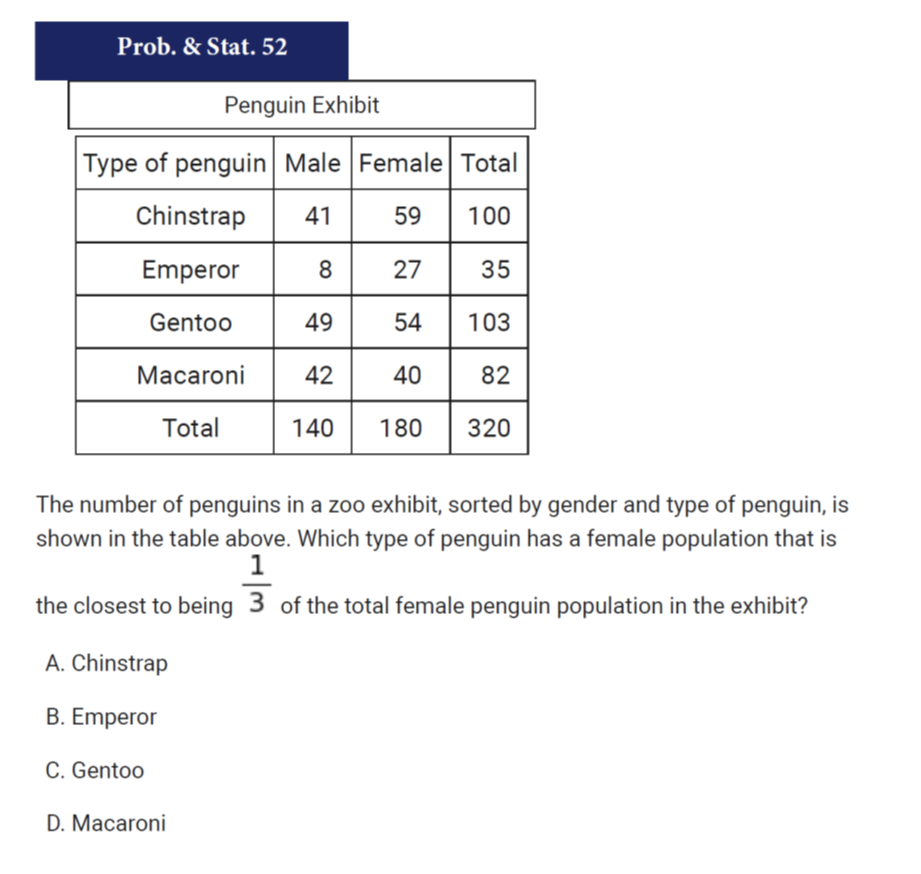
Advanced Problems with Conditional Probability Tables
There are at least three ways a conditional probability problem could be adjusted to be more complicated. It could involve a custom numerator and denominator, it could give you numbers without organizing them in a table, or it could require you to work backwards algebraically to find one of the table entries.
Custom Numerator and Denominator
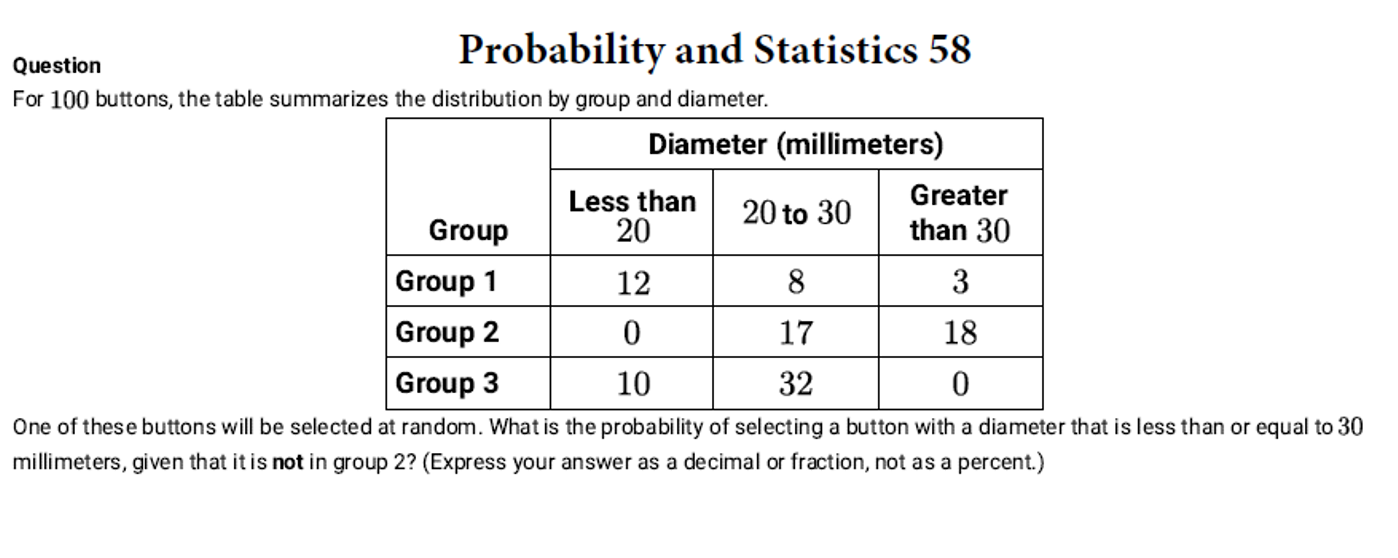
This type of problem combines a couple challenges that, on their own, are not too complicated, but which can you leave you feeling a bit lost when they come together. The denominator here is the sum of 6 of the cells in the table (the ones NOT in group 2), and the numerator is 4 of those. Because no subtotals are given, you have to add everything yourself. Then, to top it off, there are no answer choices, so you’re left with a fractional answer without a sure means of checking it. But despite those hurdles, there is no real “trick” in this problem; it just has to be read carefully
No Table Given
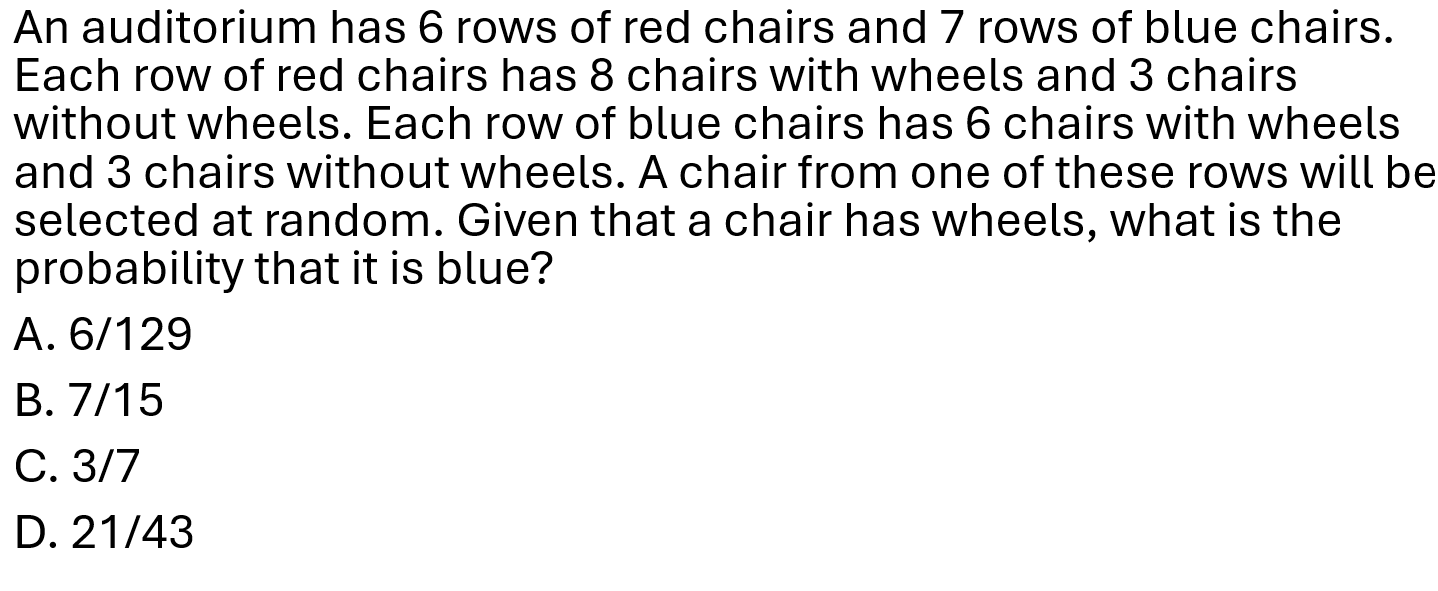
In some problems, you’re asked for a conditional probability but no table is given. Instead, information is described in a couple sentences. Even with the newest questions released, there are no questions of this type in the question bank, but there is one in the Bluebook practice tests. I try to avoid Bluebook spoilers in this blog, so here is a near-replica of that problem that has different numbers and a slightly different context:
Algebra
In a more complicated version of this problem, you have to use the same setup but then also do a little algebra. You may be told the conditional probability but have a data value in the table missing. Consider the following:
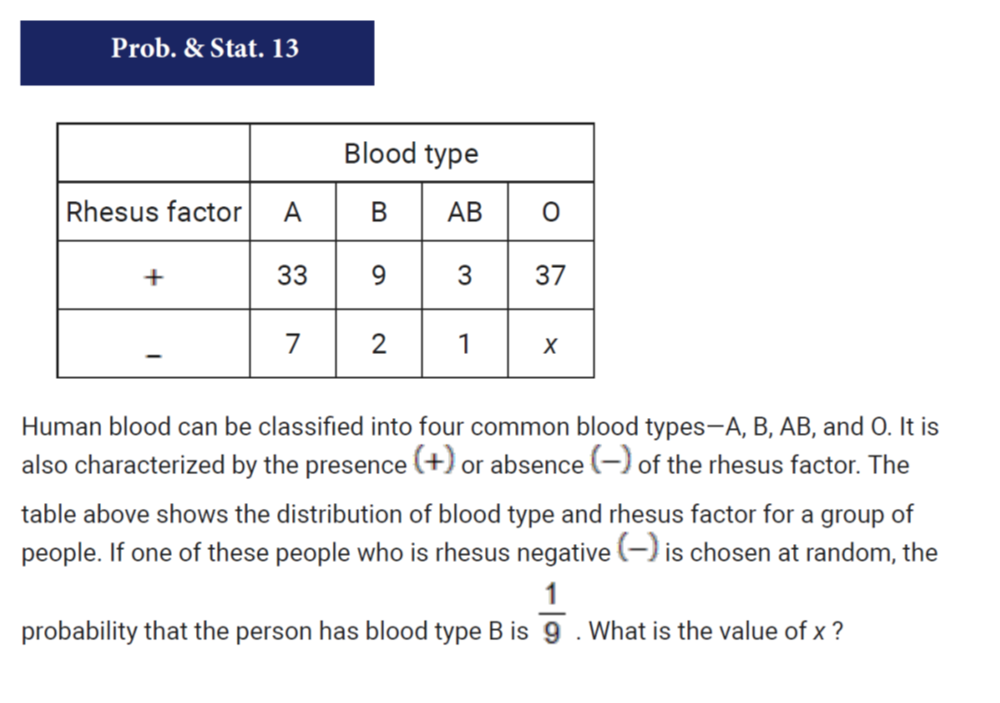
Here you have to work backwards from the conditional probability they give you. You first have to find the numerator, and then do algebra to solve for the denominator and from there solve for x.
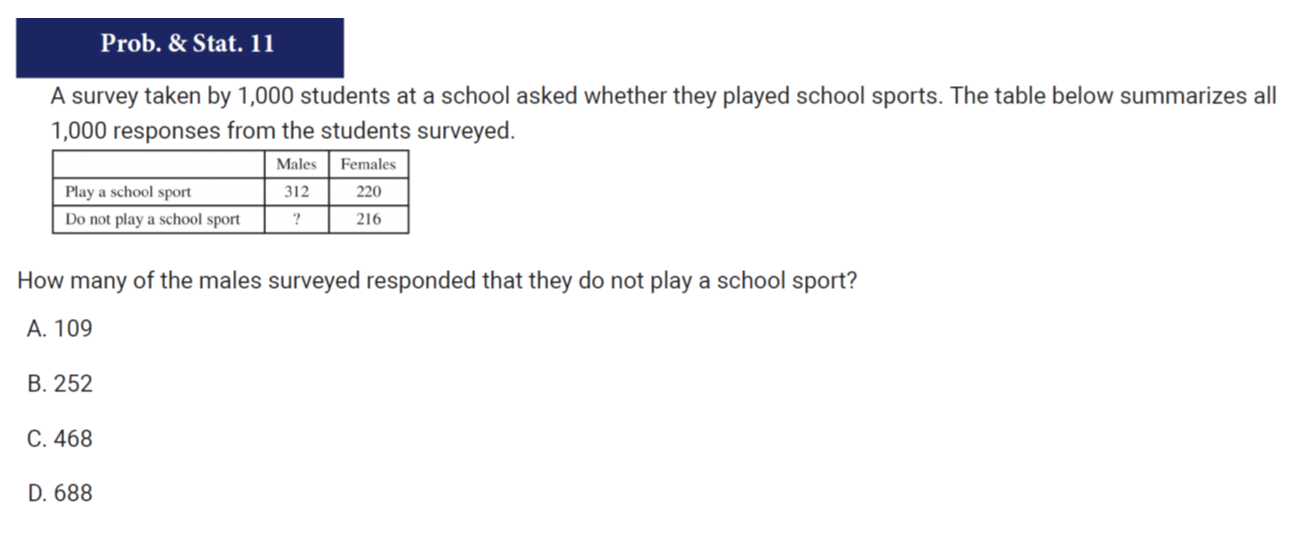
Also, note that not every question with a table with multiple columns and multiple rows is in fact a conditional probability question. It may be a simple counting question, or it may be a statistics question about a “best estimate.” Here are two examples:
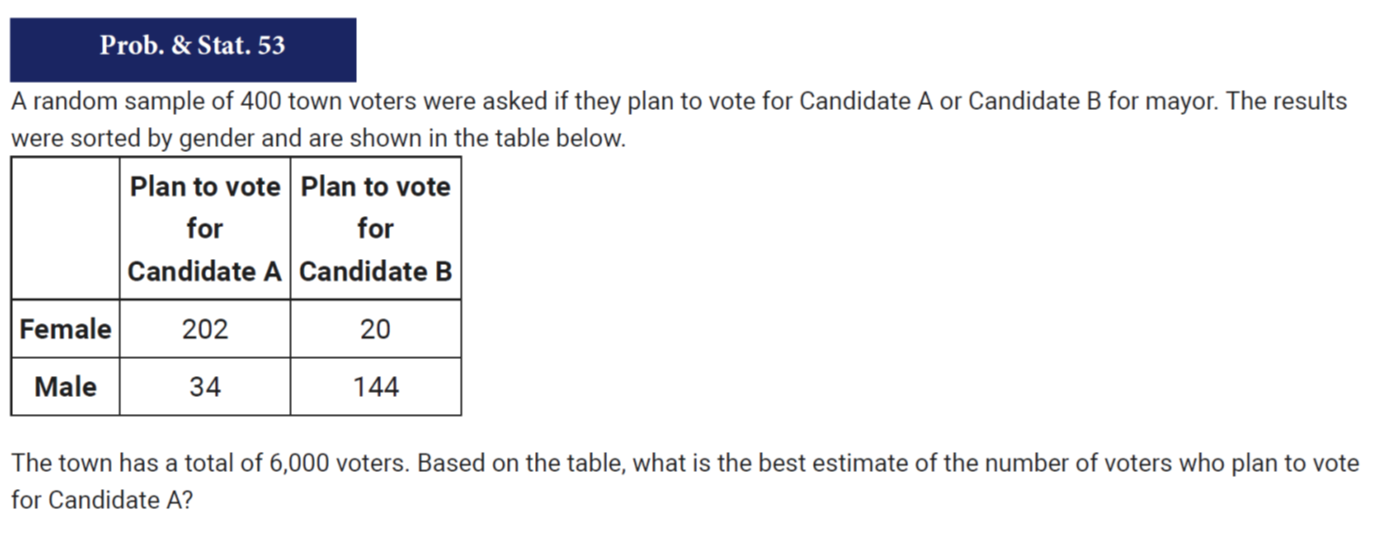
You may wonder, given the strong gender divide in candidate preference in the table, whether it makes a difference that this sample has about 55% female voters in it. But they don’t ask about that; they just about the best estimate “based on the table,” so you can just tally up the total fraction voting for candidate A in the table and figure out what number is that fraction of 6,000.